SAT Scores Highest: What a Perfect 1600 Really Means in 2026
Fewer than 1% of students who sit the SAT ever see a 1600 on their score report. The highest SAT score is 1600 — 800 on Math and 800 on Reading & Writing. Run the numbers on the Class of 2026 cohort and that's still thousands of students with a perfect score each year. They're rare. They're not unicorns. So what does the highest SAT score actually signal, and how should ambitious students in Vancouver and across BC think about chasing it?

What Is the Highest Possible SAT Score?
The SAT scoring system runs on a 400–1600 scale. Two sections make up that total: the Math section (scored 200–800) and the Reading and Writing section (also 200–800). Add both together and you get your composite.
A perfect 1600 SAT score means you earned an 800 on each section. No secret third component. No bonus points for speed.
Here's where confusion often enters: the SAT scoring system doesn't map raw correct-answer counts directly to section scores. The College Board runs an equating process across every test date to account for slight variations in difficulty. A student sitting in October and one sitting in March are compared on a level playing field — even if one test had marginally harder math problems. A 780 on a harder test date isn't worth less than a 780 on an easier one.
⚠️ How Equating Works: The College Board adjusts for test-date difficulty variations. A 780 in October equals a 780 in March — regardless of which test was harder.
No wrong-answer penalty exists on the current SAT. Every blank and every wrong answer cost the same: nothing extra beyond the missed point. That's been true since the 2016 redesign, when the test also dropped from a 2400-point scale to the current 1600.
The College Board doesn't publish a single record-holder or name the "highest ever" scorer. Thousands earn 1600 each year. The interesting questions are about what a 1600 actually signals to admissions officers — and whether chasing it is worth your time.
SAT Score Distribution: Who Actually Reaches the Top?
According to College Board data (Class of 2025 cohort, the most recently published full-year data at time of writing), the top 1% of all test-takers — roughly those scoring between 1530 and 1600 — represented tens of thousands of students. The 1400–1600 range captures approximately the top 7% of all test-takers. That's a meaningful slice, but still a long way from average.
The national average SAT score sits around 1050. A student scoring 1400 has outperformed roughly 93 out of every 100 people who sat the same test. That gap is larger than most students realize until they see the percentile tables.
Here's where the top scorers actually fall:
| Score Band | Approx. % of Test-Takers | Percentile Rank |
|---|---|---|
| 1580–1600 | <1% | 99th+ |
| 1500–1579 | ~1–2% | 97th–99th |
| 1400–1499 | ~5–6% | 93rd–96th |
| 1300–1399 | ~11–12% | 82nd–92nd |
| 1200–1299 | ~15% | 74th–81st |
| 1050–1199 | ~25% | 50th–73rd |
What this means for your strategy: Students at Sentinel in West Vancouver or U Hill in UBC's backyard often assume their peer group represents "normal." It doesn't. Their school environments skew heavily toward the upper end of the SAT score distribution, which creates a warped sense of where the bar actually sits nationally.
To see exactly where a specific score falls among test-takers, our SAT percentile ranks guide walks through every band in detail.
What Percentile Is a 1500? A 1400? A 1300?
A 1500 = 96th–97th percentile. A 1400 = 93rd–95th percentile. A 1300 = 87th percentile. Percentile rank shows where your score falls relative to all test-takers in your cohort — not a letter grade. A 1300 means you outperformed 87% of students, which is genuinely strong for most university applications.
Worth sitting with that for a second. A 1300 isn't a "B." It's a top-13% result among everyone who sat the same test.
What the Digital SAT Transition Actually Changed (And What Stayed the Same)
By 2026, every student taking the SAT has only ever taken the digital version. The paper test is a historical artifact for this cohort. The adaptive format means the second module of each section adjusts in difficulty based on how you performed in the first. That changed how students experience the test — but not how scores are ultimately compared.
College Board data suggests mean scores shifted modestly after the digital transition, then stabilized. Students at Burnaby North and Coquitlam-area schools who prepared with the Bluebook app's adaptive practice tools have generally found the format manageable. The bigger adjustment was pacing, not content.
The superscore SAT effect also compounds this. Students who test multiple times and combine their highest section scores across attempts can push into higher composite bands without a single "peak" performance on one date. Most top universities accept superscores — covered in detail shortly.
Have Top SAT Scores Changed Since 2023?
Three full digital SAT cycles have now passed. Mean scores shifted modestly after the digital transition, then stabilized.
College Board data shows the national mean has remained near 1050, with modest variation year over year. More relevant for high-achieving students: the top-percentile threshold has held broadly steady. Scoring 1530+ typically places a student in approximately the top 1% of test-taker performance, though the exact cutoff can shift slightly year to year.
What has changed is score compression in the 1400–1500 band. More students are reaching this range as digital prep resources have improved, which means the marginal value of a 1450 versus a 1480 has narrowed at many schools. Above 1500, the distribution remains thin. The gap between a 1520 and a 1580 in raw test-taker population terms is smaller than most students expect — but both still represent exceptional performance.
Where Top Performers Come From: State, School Type & Demographics
The participation-rate paradox is one of the most misunderstood dynamics in SAT benchmarks. States with mandatory SAT testing — where essentially every junior takes it — show lower average scores than states where the test is optional and only college-bound students bother sitting it. This isn't a capability difference. It's pure selection effect.
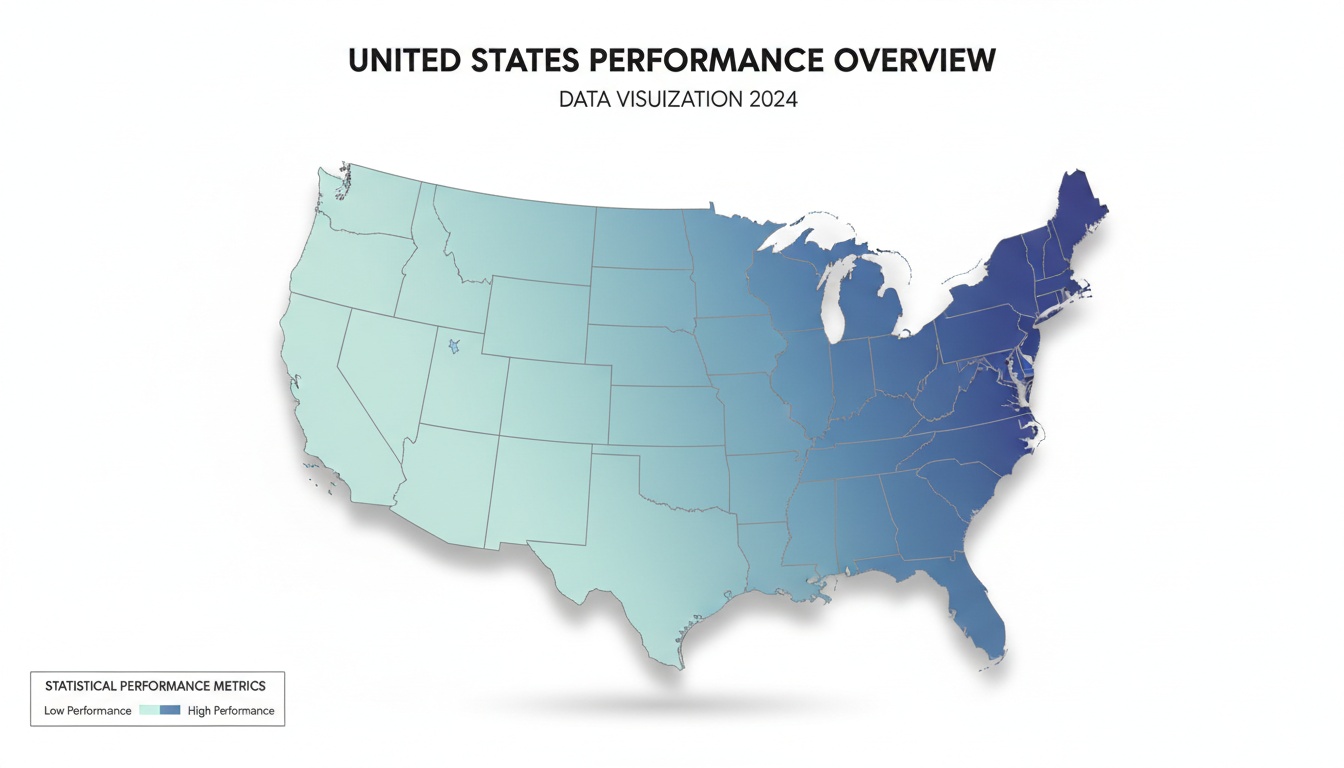
In practice, this shows up clearly: Massachusetts, Connecticut, and New Jersey consistently report the highest average SAT scores among states — typically in the 1100–1150 range, though exact figures vary by year — while also having lower participation rates than states like Michigan or Idaho, where the SAT is administered to all students. When you're comparing state averages, you're often comparing apples to very different apples.
Specialized STEM magnet schools — Thomas Jefferson High School for Science and Technology in Virginia, Stuyvesant in New York — consistently report average scores near the top of the national distribution. These schools select for academic ability at entry, so their averages reflect their student population. There's no magic in the curriculum.
The demographic picture is harder to discuss briefly, but the College Board's own published data consistently shows persistent score gaps by household income and first-generation status. Students from families earning above $100,000 annually score meaningfully higher on average than those from lower-income households. That reflects access to test preparation, stable study environments, and the ability to retake the test multiple times — not ability differences.
For Vancouver families: many students at Richmond high schools or in Coquitlam's Chinese-Canadian community arrive with strong math foundations from earlier schooling. The Math section often plays to those strengths.
College Board data consistently shows international test-takers outperforming the domestic US average on the Math section — a gap that has held through the digital transition. On the Reading and Writing section, the pattern reverses: domestic native English speakers tend to score higher. For BC students writing the SAT as international test-takers, this asymmetry is worth building a prep strategy around.
Private vs. Public School SAT Averages
Private schools like York House, Crofton House, and St. George's in Vancouver tend to show higher average SAT scores than standard public schools. The gap is smaller than most parents expect, though. The bigger differentiator is whether the school actively integrates SAT preparation into its academic culture, not the tuition price tag.
Admissions officers at top US universities are fully aware of school context. A 1450 from a student at a rural public school with no AP program reads differently than a 1450 from a student at a well-resourced private school with a dedicated college counselor. This is exactly why the middle-50% range at your target school matters more than any single cutoff number.
What SAT Score You Actually Need for Harvard, MIT, and Yale (2026)
This is the table that students and parents in West Vancouver and North Van tend to screenshot and save.
Middle-50% ranges reflect admitted students from the Class of 2025 cohort (the most recently published full-year data at time of writing). Ranges may shift by 10–20 points year over year. Test policies reflect the 2025–2026 admissions cycle.
| University | Middle-50% SAT Range | Test Policy (2026) | Superscore? |
|---|---|---|---|
| Harvard | 1500–1580 | Required | Yes |
| MIT | 1520–1580 | Required | Yes |
| Stanford | 1510–1570 | Required | Yes |
| Yale | 1500–1570 | Required | Yes |
| Princeton | 1470–1570 | Required | Yes |
| Columbia | 1470–1560 | Test-flexible (SAT/ACT or AP/IB scores accepted) | Yes |
| Penn | 1470–1560 | Required | Yes |
| Dartmouth | 1470–1570 | Required | Yes |
| Duke | 1480–1570 | Required | Yes |
| Johns Hopkins | 1500–1570 | Test-optional | Yes |
| Georgetown | 1400–1560 | Required (all scores) | No |
| UCLA | — | Test-blind | N/A |
| UC Berkeley | — | Test-blind | N/A |
⚠️ Georgetown requires all SAT scores, not just your best (as of 2026). If you had a rough first attempt, factor that into your testing strategy before registering.
⚠️ UCLA and UC Berkeley are test-blind — the UC system does not consider SAT or ACT scores in admissions decisions, so submitting scores has no impact on your application.
The middle-50% range shows where the 25th to 75th percentile of admitted students who submitted scores actually landed. It's more useful than a single cutoff because it shows the realistic spread. Half of Harvard's admitted students scored below 1580 — worth remembering when a 1560 starts to feel inadequate.
These SAT benchmarks matter because MIT, Princeton, Harvard, Stanford, Yale, Penn, Dartmouth, Duke, and a growing number of top schools have moved away from the test-optional experiment that many schools adopted in recent years. If your student is targeting test-required schools, a strong score is no longer optional. Johns Hopkins remains test-optional for the 2025–2026 cycle — meaning submitting a strong score can still strengthen your application, but is not mandatory. Columbia accepts a broader range of standardized tests including AP and IB scores in addition to the SAT/ACT.
What Is a "Good" SAT Score for Top Schools?
A "good" score depends on your target school. A 1200 = 74th–75th percentile (above average). A 1280–1350 = 84th–90th percentile (strong for most universities). For Ivy League schools, the floor is effectively 1470. Our rule: aim for the 75th percentile of your target school's admitted class — not their 25th percentile floor. If Stanford's 75th percentile is 1570, that's your working target.
The Methodology Behind 1500+ Scores
After working with students from Magee, West Point Grey, and Burnaby North over the past three admissions cycles (2023–2026), a pattern emerges clearly. Students who reach 1500+ don't just study harder. They study differently.
The difference comes down to method. Most students prep wrong. They re-read explanations for questions they got wrong, feel like they understand, and move on. The error-log methodology — writing down the specific reasoning error you made on each question, not just what the right answer was — sounds tedious. It's what actually moves scores.
The College Board offers eight full-length digital practice tests through the Bluebook app, free and adaptive. Students who complete all eight under timed conditions, then systematically review every wrong answer using an error log, consistently outperform students who work through prep books passively or skip the timed constraint.
Khan Academy's free personalized SAT prep is one of the most underused tools available. We've watched students use it to close 150-point gaps without spending a dollar on commercial prep.
Case Study: 1320 → 1490 in 14 Weeks
A Grade 11 student at U Hill came in at 1320 on her first practice test. Over 14 weeks, she completed all eight Bluebook practice tests under timed conditions, kept a handwritten error log, and used Khan Academy's adaptive Reading and Writing modules. No commercial prep course. Official score: 1490 (verified through official College Board score report). The shift wasn't the hours — it was switching from re-reading wrong answers to writing down the specific reasoning error she made on each one.
Score improvement trajectories vary. Most students gain 20–30 points per retake on average. But moving from 1400 to 1500 requires identifying and eliminating specific, recurring error patterns. More practice volume alone won't get you there. Moving from 1500 to 1600 is exponentially harder. At that level, every point requires addressing micro-errors in timing and reading precision, plus algebraic fluency gaps simultaneously.
For most students, the jump from 1450 to 1500 produces more marginal admissions value than the jump from 1500 to 1580. The diminishing-returns zone above 1500 is real. Time spent chasing a perfect 1600 might be better invested in a research project, a meaningful extracurricular, or simply writing better essays.
If you're planning where to sit the exam, our complete guide to SAT test centers in BC: registration deadlines and locations covers all the Vancouver-area options.
The Optimal Number of SAT Attempts (And When to Stop)
Two to three attempts is the sweet spot. Most top universities accept superscores — meaning your best Math score from one date combines with your best Reading & Writing score from another to form your composite. After three attempts, diminishing returns set in for most students, both in score gains and emotional energy.
The emotional cost of repeated test prep starts to erode the time and energy that could go toward applications and the essays that actually matter.
Beyond the Perfect Score: Real Outcomes for Students with 1500+ SAT Scores
The National Merit Scholarship program uses a Selection Index based on PSAT scores that correlates roughly to an SAT equivalent that varies by state and year — typically somewhere in the 1480–1520+ range for competitive states, though students should check current cutoffs for their specific state.
Full-ride merit scholarships at non-Ivy flagship universities — University of Alabama, University of South Carolina's Honors College, Tulane — frequently require 1500+ SAT scores. These programs are competitive and produce strong outcomes for students who prioritize scholarship value over brand prestige.
The acceptance rate differential for 1500+ applicants versus the general pool at top-25 schools is real but smaller than most families expect. A 1580 doesn't make you a likely admit at Harvard — their acceptance rate has remained under 4% in recent admissions cycles. What it does is clear a threshold so the rest of your application can be evaluated seriously.
Employers and graduate schools almost never see your undergraduate SAT score. The score's value is almost entirely front-loaded into the admissions funnel. Once you're in, it disappears.
We've seen students with 1600s at Ivies and students with 1600s who chose merit scholarships at strong public universities. Both groups produced doctors, engineers, and founders. The score is a door-opener, not a destiny.
A 1500+ is exceptional. Chasing the last 50 points should never come at the cost of sleep, extracurriculars, or the essay that actually shows who you are. If you're weighing whether to submit scores at all, our guide to which schools have reversed SAT-optional policies in 2026 breaks down what that means for your strategy.
For high-achieving students also considering the US boarding school route as a pathway to top universities, our US boarding school vs. Canadian schools: admissions and cost tradeoffs covers the tradeoffs honestly.
Key Takeaways
- The highest SAT score is 1600: 800 Math + 800 Reading & Writing.
- Only ~1% of test-takers reach 1580–1600; the top 7% score 1400+.
- The national average is ~1050 — most competitive applicants score well above this.
- Ivy League middle-50% ranges run 1470–1580; MIT, Princeton, Harvard, Stanford, Yale, Penn, Dartmouth, and Duke require scores for the 2025–2026 cycle.
- Johns Hopkins is test-optional for the 2025–2026 cycle; Columbia accepts SAT/ACT or AP/IB scores.
- UCLA and UC Berkeley are test-blind — SAT scores are not considered in UC admissions.
- Superscore policies make 2–3 test attempts worthwhile at most top schools.
- State SAT averages are misleading — participation rates distort the numbers.
- Above 1500, diminishing returns are steep; a 1520 and 1580 often produce identical outcomes.
- No evidence of score inflation since the digital transition — 1580+ remains a genuine ceiling.
Ready to build a personalized SAT prep strategy? Book a free 30-minute consultation with a Vancouver-based admissions consultant who specializes in SAT strategy for BC students. We'll review your target schools, assess your current score, and map a realistic path to your goal.